
Q2 2022: State of the Market with Co-Founder & Principal, Michael Becker
State of the Market: "It was the Best of Times, It was the Worst of Times"
Written by Michael Becker
Q2 2022 Newsletter
Michael Becker Here...
As the famous quote from the Charles Dickens book, A Tale of Two Cities goes: "It was the best of times, it was the worst of times." I think that adequately sums up today's Multifamily market.
Anyone who has followed my thoughts on the Multifamily market over the past few years has heard me proclaim that we have been living in "The Golden Age" of Multifamily; we’ve seen tremendous growth in both rental rates as well as cap rate compression, which, in tandem, has led to unbelievable growth in valuations. Anyone who invested alongside SPI over the last decade or so has experienced transformational wealth creation. But, as we transitioned from Q1 to Q2 2022, the winds which used to only be at our backs are now swirling into a mix of headwinds and tailwinds.
Let me elaborate . . .
Tailwinds of Positive Growth
Over the past year, we saw incredible rental rate growth across the portfolio. As of now, we haven’t seen this trend let up at all. Currently, we’re experiencing effective rental rate growth percentages in the high-teens to low-twenties on new leases and low to mid-teens on renewals.
Why is that? I believe it's for a few reasons . . .
Job Growth
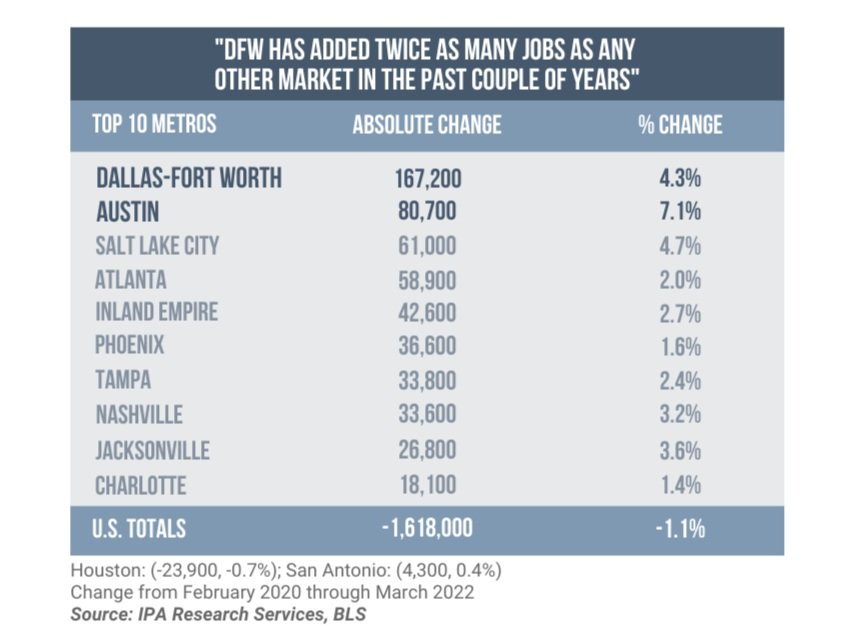
Recently, I spoke on a panel with Greg Willet, former Chief Economist at RealPage who has now joined IPA. During this panel, Greg displayed a few compelling slides that help explain the driving factors for the recent increase in rental demand. The first factor he discusses is job growth. As we’ve discussed before, Texas job growth has dramatically outpaced the nation, post-pandemic Looking at the charts below, you can see that the top 2 Metros in Absolute Job Growth across the nation are DFW and Austin – SPI’s two largest markets.
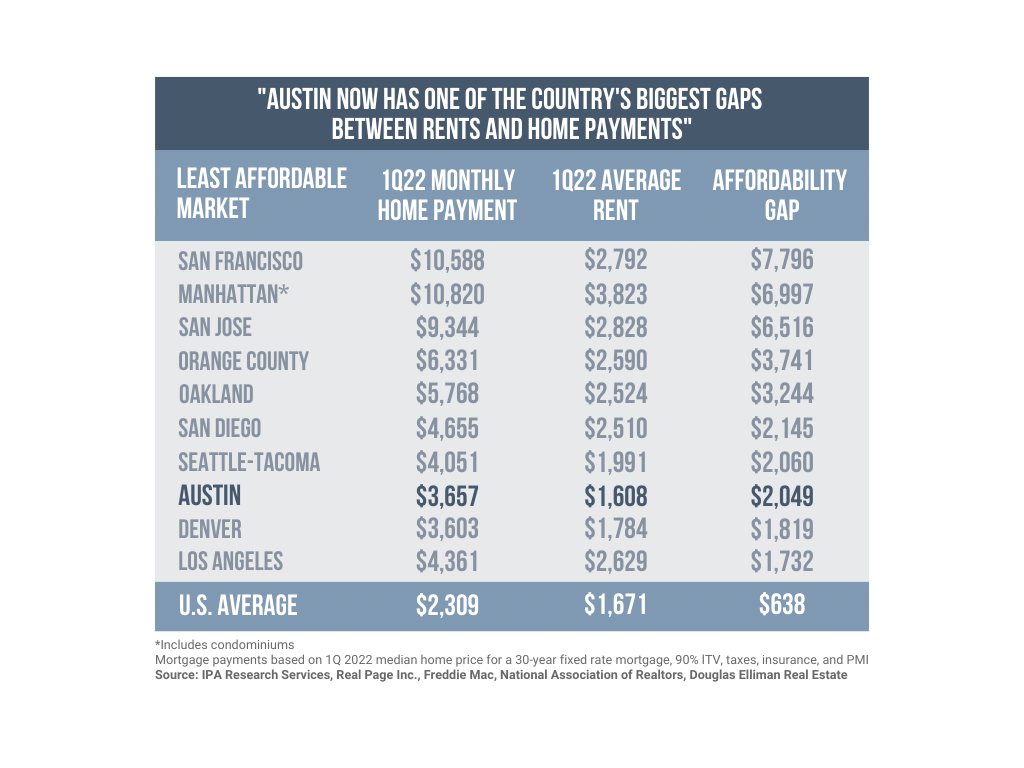
Couple job growth and population growth with homeownership becoming increasingly less affordable, there's been a significant increase in renter demand. As the chart below shows, currently, in Austin, on average, it's $2k+ a month more expensive to make a mortgage payment than to rent an apartment.
People follow jobs and job growth, so it makes sense that all 4 major Texas markets are at or near the top in the nation in terms of total absorption of apartment units since the pandemic-induced lockdowns, as the chart below indicates.
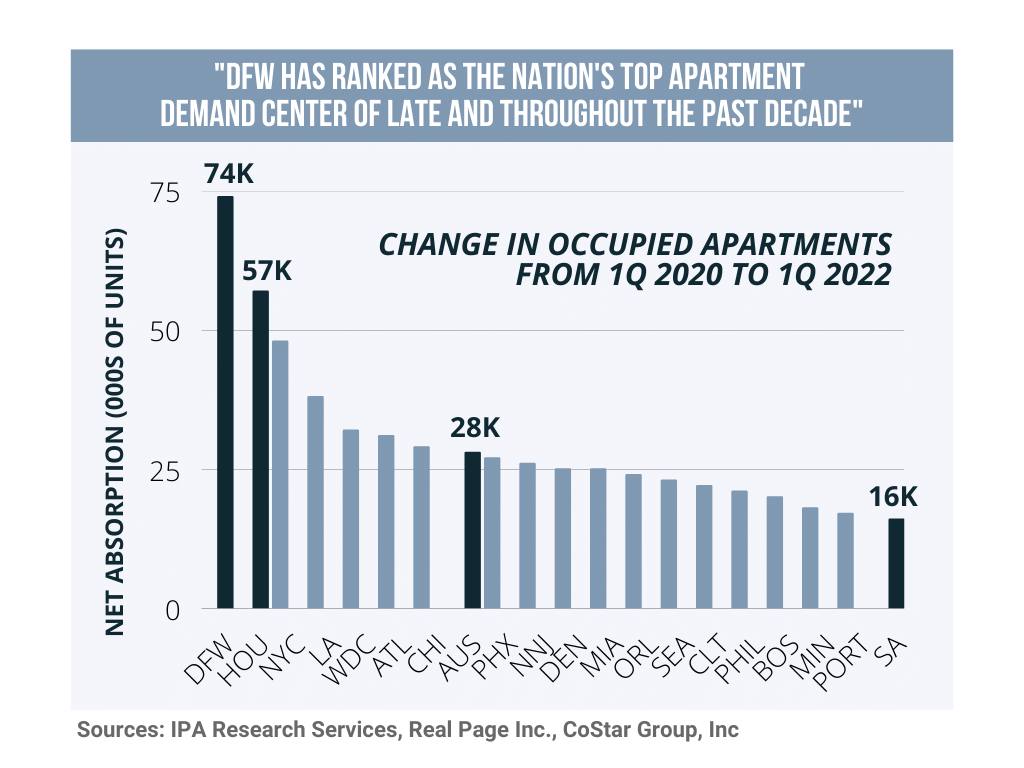
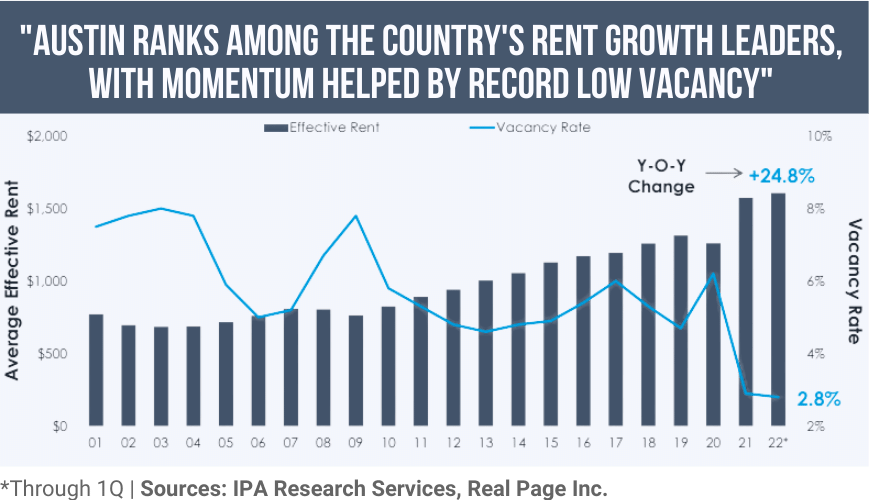
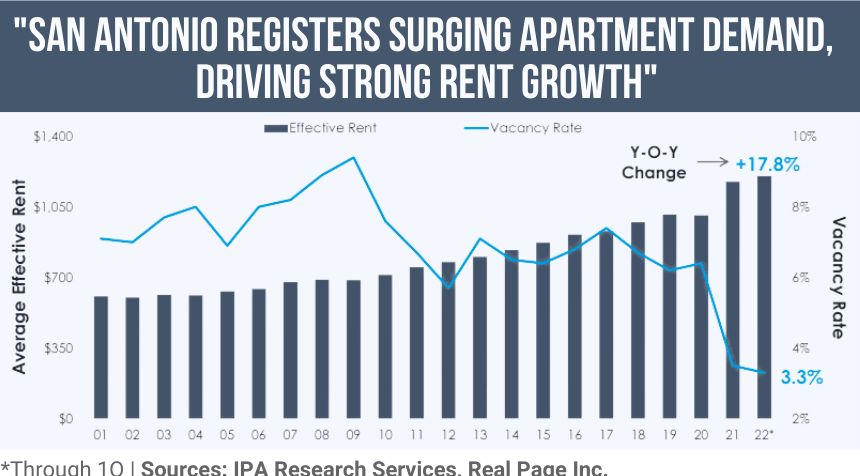
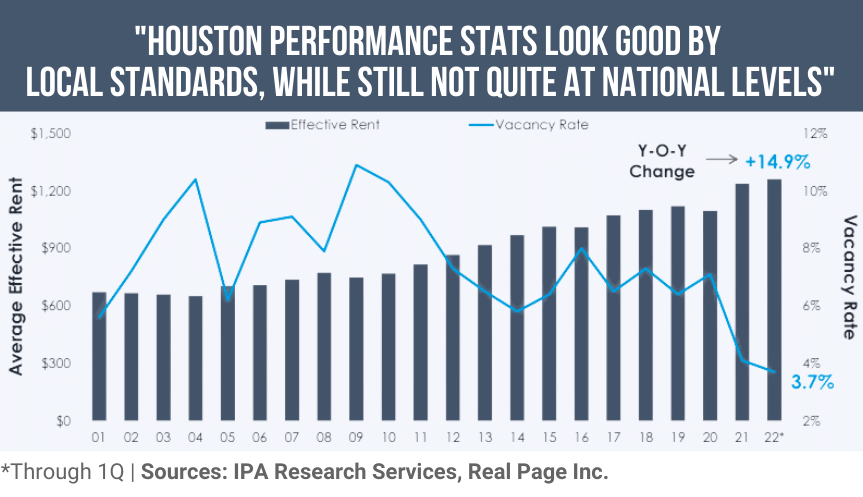
As this data suggests, all 3 of the markets SPI invests in (DFW, Austin, & San Antonio) have seen significant increases in occupancy and tremendous rental rate growth. Houston, a market SPI has chosen not to participate in, has also done well but lags the other 3 Texas Markets and the Nation as a whole.
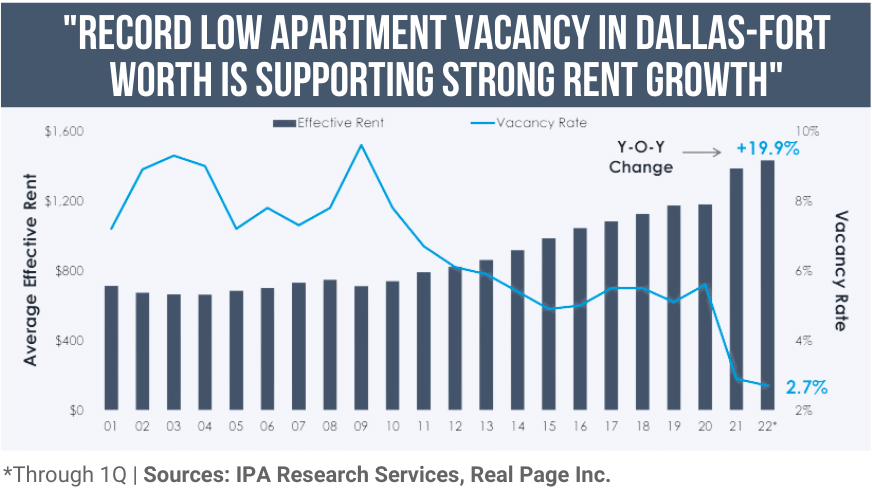
In conclusion, Multifamily operational metrics remain off the charts as we enter the summer of 2022.
Headwinds – Property Taxes, Rising Interest Rates, & Deteriorating Capital Markets
Property Taxes
One of the biggest differences in the Multifamily industry is how property taxes are treated in each state. In Texas, we have our values reassessed annually without a cap, so, dramatic swings year-over-year are common, unlike in other sates, where they only adjust every few years or put a cap on the annual increase.
In 2021, we were given a reprieve due to the COVID pandemic. In 2022, it seems like the County Appraisal Districts are trying to make up for lost time, and consequently, we have seen tremendous increases in noticed appraised values right out of the gate. We will continue to protest these values and attempt to get the numbers down materially, and due to a change in state law, we also expect to see millage rates come down... However, at the end of the day, it appears that we can expect to see substantially higher tax bills than we did last year, thereby impacting our NOI’s.
Interest Rates
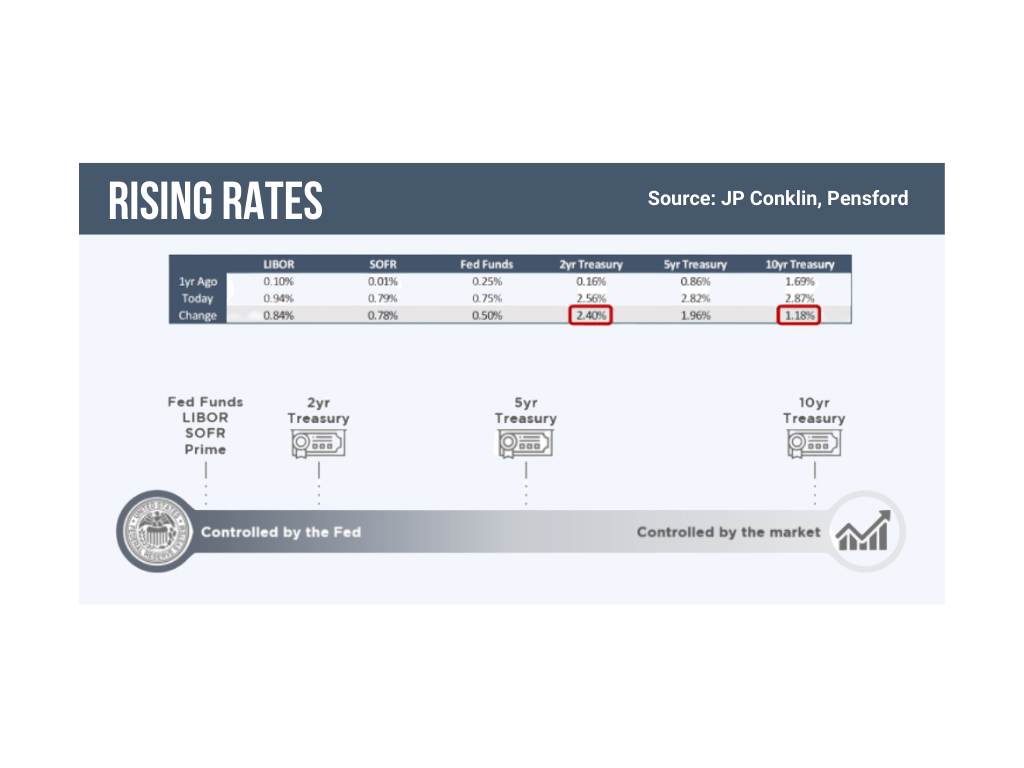
As recently as November of 2021, the Federal Reserve stated they didn't expect a single rate hike in 2022. Boy have they changed their tune . . . As of May 2022, the Fed has hiked rates twice up to a total of 75bps and signaled that it’s a mortal lock they will hike 50bps each at both the June and July meetings. This implies SOFR & LIBOR will be just under 200bps, or 2%, by August 2022. While that might not sound like a lot in historical terms, in all recorded history, we have never seen this rapid rate of change on the short end of the yield curve. This phenomenon is illustrated in the following chart taken from a presentation given by JP Conklin, the Founder & President of Pensford, which shows the rate of change in the 2-year and 10-year Treasury rates. As the data presented by Conklin indicates, the 2-year rate is up 15x from just one year ago. This has also caused the cost of Interest Rate Caps to explode higher as well.
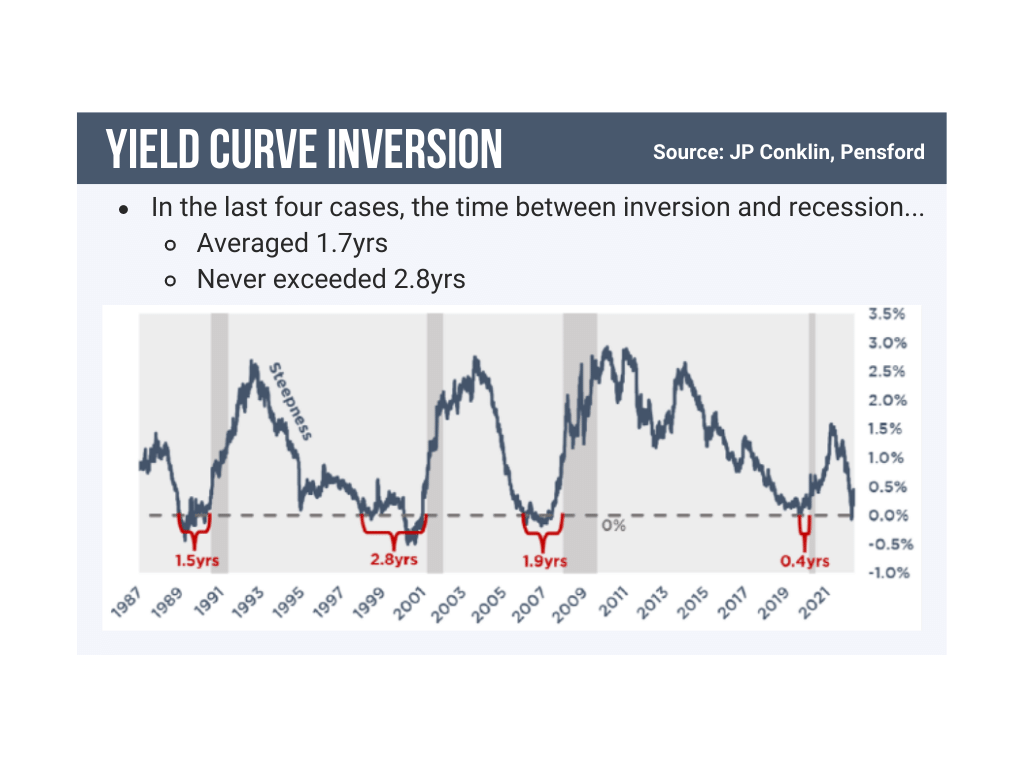
As evidenced by the recent volatility and decline of the stock market, there is a growing fear that the Federal Reserve is going to make a policy mistake and hike us into a recession in its effort to fight inflation. At the beginning of Q2 2022, there was an inversion in the yield curve where the 2-year Treasury rates were higher than the 10-year rates. The curve has since been un-inverted, however, the 2s/10s inversion has historically been a reliable warning signal of an impending recession.
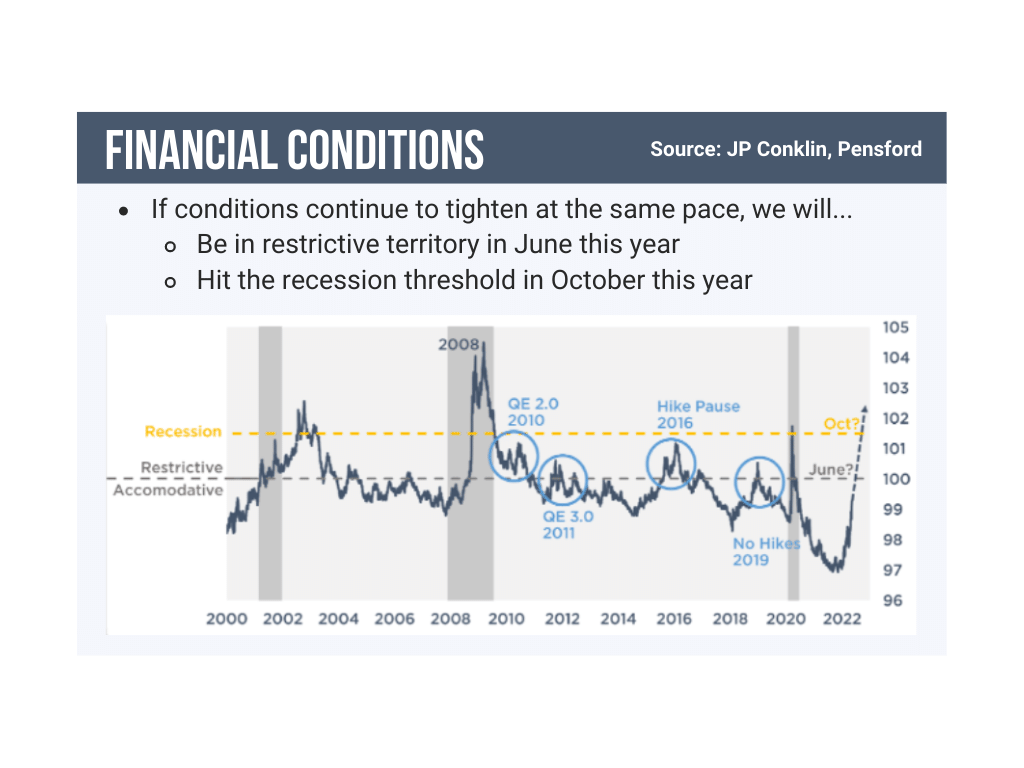
The chart below shows that financial conditions are expected to become neutral with the June rate hike, and the market expects financial conditions to become restrictive by October, further stoking the impending recession fears.
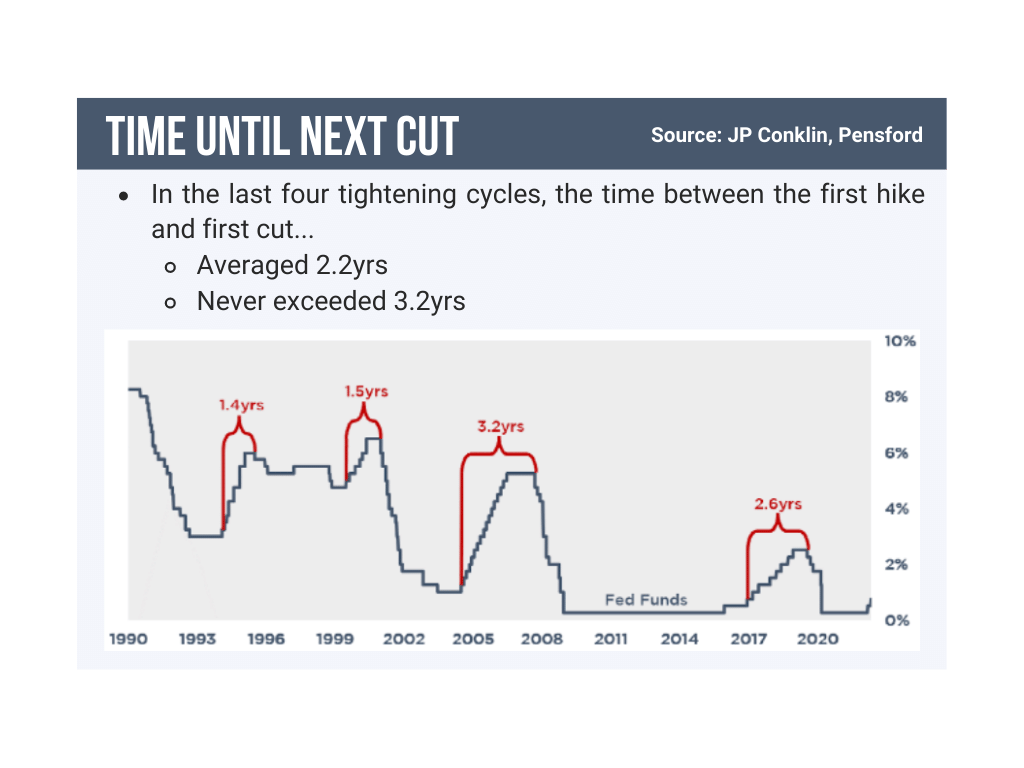
With all the saber-rattling coming out about the Federal Reserve raising rates, many are betting we will see interest rate increases for many years to come. History would tell us otherwise . . . the chart below shows that the longest time in history between the first rate hike to the time the Fed cuts, is 3.2 years, and the average time is 2.2 years. If history holds true, the Federal Reserve will likely put the economy into a recession in their attempts to fight inflation and will cut rates before we know it.
Choppy Capital/Debt Markets
The volatility in the stock market, rising interest rates, and recession fears have caused the lending environment to materially worse since Q1 2022.
As of recent, we have seen several lenders, in particular, the Debt Funds who experienced extreme popularity with value-add investors during the last 18 months, go pencils down. The Agencies are largely on the sidelines as their underwriting criteria have them sizing to sub-50% LTV on most deals due to rising interest rates and the fixed-rate equivalent sizing rates they use. So, while you can get a loan from Fannie or Freddie, due to the LTV’s, they just don’t make much sense from an economic viewpoint in most cases today.
So, what was a very active, deep, and diverse lender pool in Q1 has now thinned out dramatically in Q2. As a result, the overall leverage available is lower, in addition to the lender spreads widening on top of the higher indexes, thereby making all-in interest rates higher. Understandably, this is making deals more difficult to underwrite and is slowing down the investment sales market. As a consequence, sellers’ pricing expectations have decreased, but there still appears to be a bid/ask spread between what buyers want and what sellers are willing to accept. It will just take time for this to work itself out.
As I have stated countless times over the past 4-5 years, Multifamily CAP rates have come in so much, that regardless of property grade or quality of location, CAP rates were nearly the same if you had purchased a Class A property in a great area, or a Class C property in a less desirable area. This notion made no sense to us, which is why we took the time to trade up in quality over the past several years. Today, 82% of our current portfolio is made up of Class A/A- properties, and 18% is made up of Class B/C. Conversely, Class B/C, properties comprise 83% of our sold portfolio while Class A/A- make up 17%. While we were early on that call, that decision appears to be paying off right now.
In my observation, it appears that Class A Multifamily pricing is off about 5% from Q1. The Workforce housing (Class B & C) pricing is off 10%, or possibly even more, in inferior locations. With that said, to put this in perspective for the Class A product specifically, a 5% price reduction generally indicates we are back to where deals were priced in Q4 of 2021.
This suggests that Workforce housing might be approaching the equivalent of Q2 2021 pricing. If you refer to our Q1 2022 Newsletter, I discussed how limited inventory led to dramatic increases in pricing at the beginning of the year, so I think some of the price gains we experienced in Q1 were the consequence of a "GameStop-Style" short squeeze effect. Due to the limited number of transactions in Q1, it wasn’t indicative of what true market pricing would have been if there were more inventory available.
What does all of this mean for SPI Advisory in 2022?
Now, there is still liquidity in the market, and the banks & the agencies are still lending money, so this isn’t a 2008/2009 replay, as of now. As I discussed above, there are still very strong fundamentals at play for our operations – renter demand is through the roof and overall investor sentiment still seems favorable for Multifamily. It appears we just need the capital markets to stabilize and hopefully we’ll see lower inflation prints in the upcoming months, thereby reducing the need for the Federal Reserve to continue its tough talk about raising rates. If this does happen, I think we will see investment sales volume pick up dramatically. It might take until after this summer for these changes to take effect, as I expect a lot of Multifamily owners to go to Hawaii or Europe for exotic vacations after being cooped up in their homes for the last 2 years. So, I expect Q4 to be the strongest sales volume quarter of the year.
The wild card is how severe the seemingly impending recession will be. Is it a garden variety recession, or is it 2008 again? I'm betting it's closer to a garden variety recession, as the Fed has shown its willingness to print money and have zero % rates as its tool to fight recessions in the past.
WE, AT SPI ADVISORY, ARE STILL BULLISH IN THE MEDIUM TO LONG TERM ON TEXAS MULTIFAMILY. I feel very confident about the strategy we implemented a few years ago which served to reposition our portfolio by replacing Class C, Workforce Housing with more Class A properties. This strategy appears to be more resilient with the real-time data we are currently seeing play out. As we have always done, going forward, we at SPI Advisory are going to continue to focus on identifying opportunities that make sense to us and think are the best relative value at that time. We think that the Federal Reserve will have to pause or reverse course and cut rates sooner than the market currently projects. Time will tell if I am right on that call. Maybe we dip our toes back in the Workforce Housing space if their values continue to degrade further and provide a better CAP rate arbitrage than the Class A space.
Cheers,